
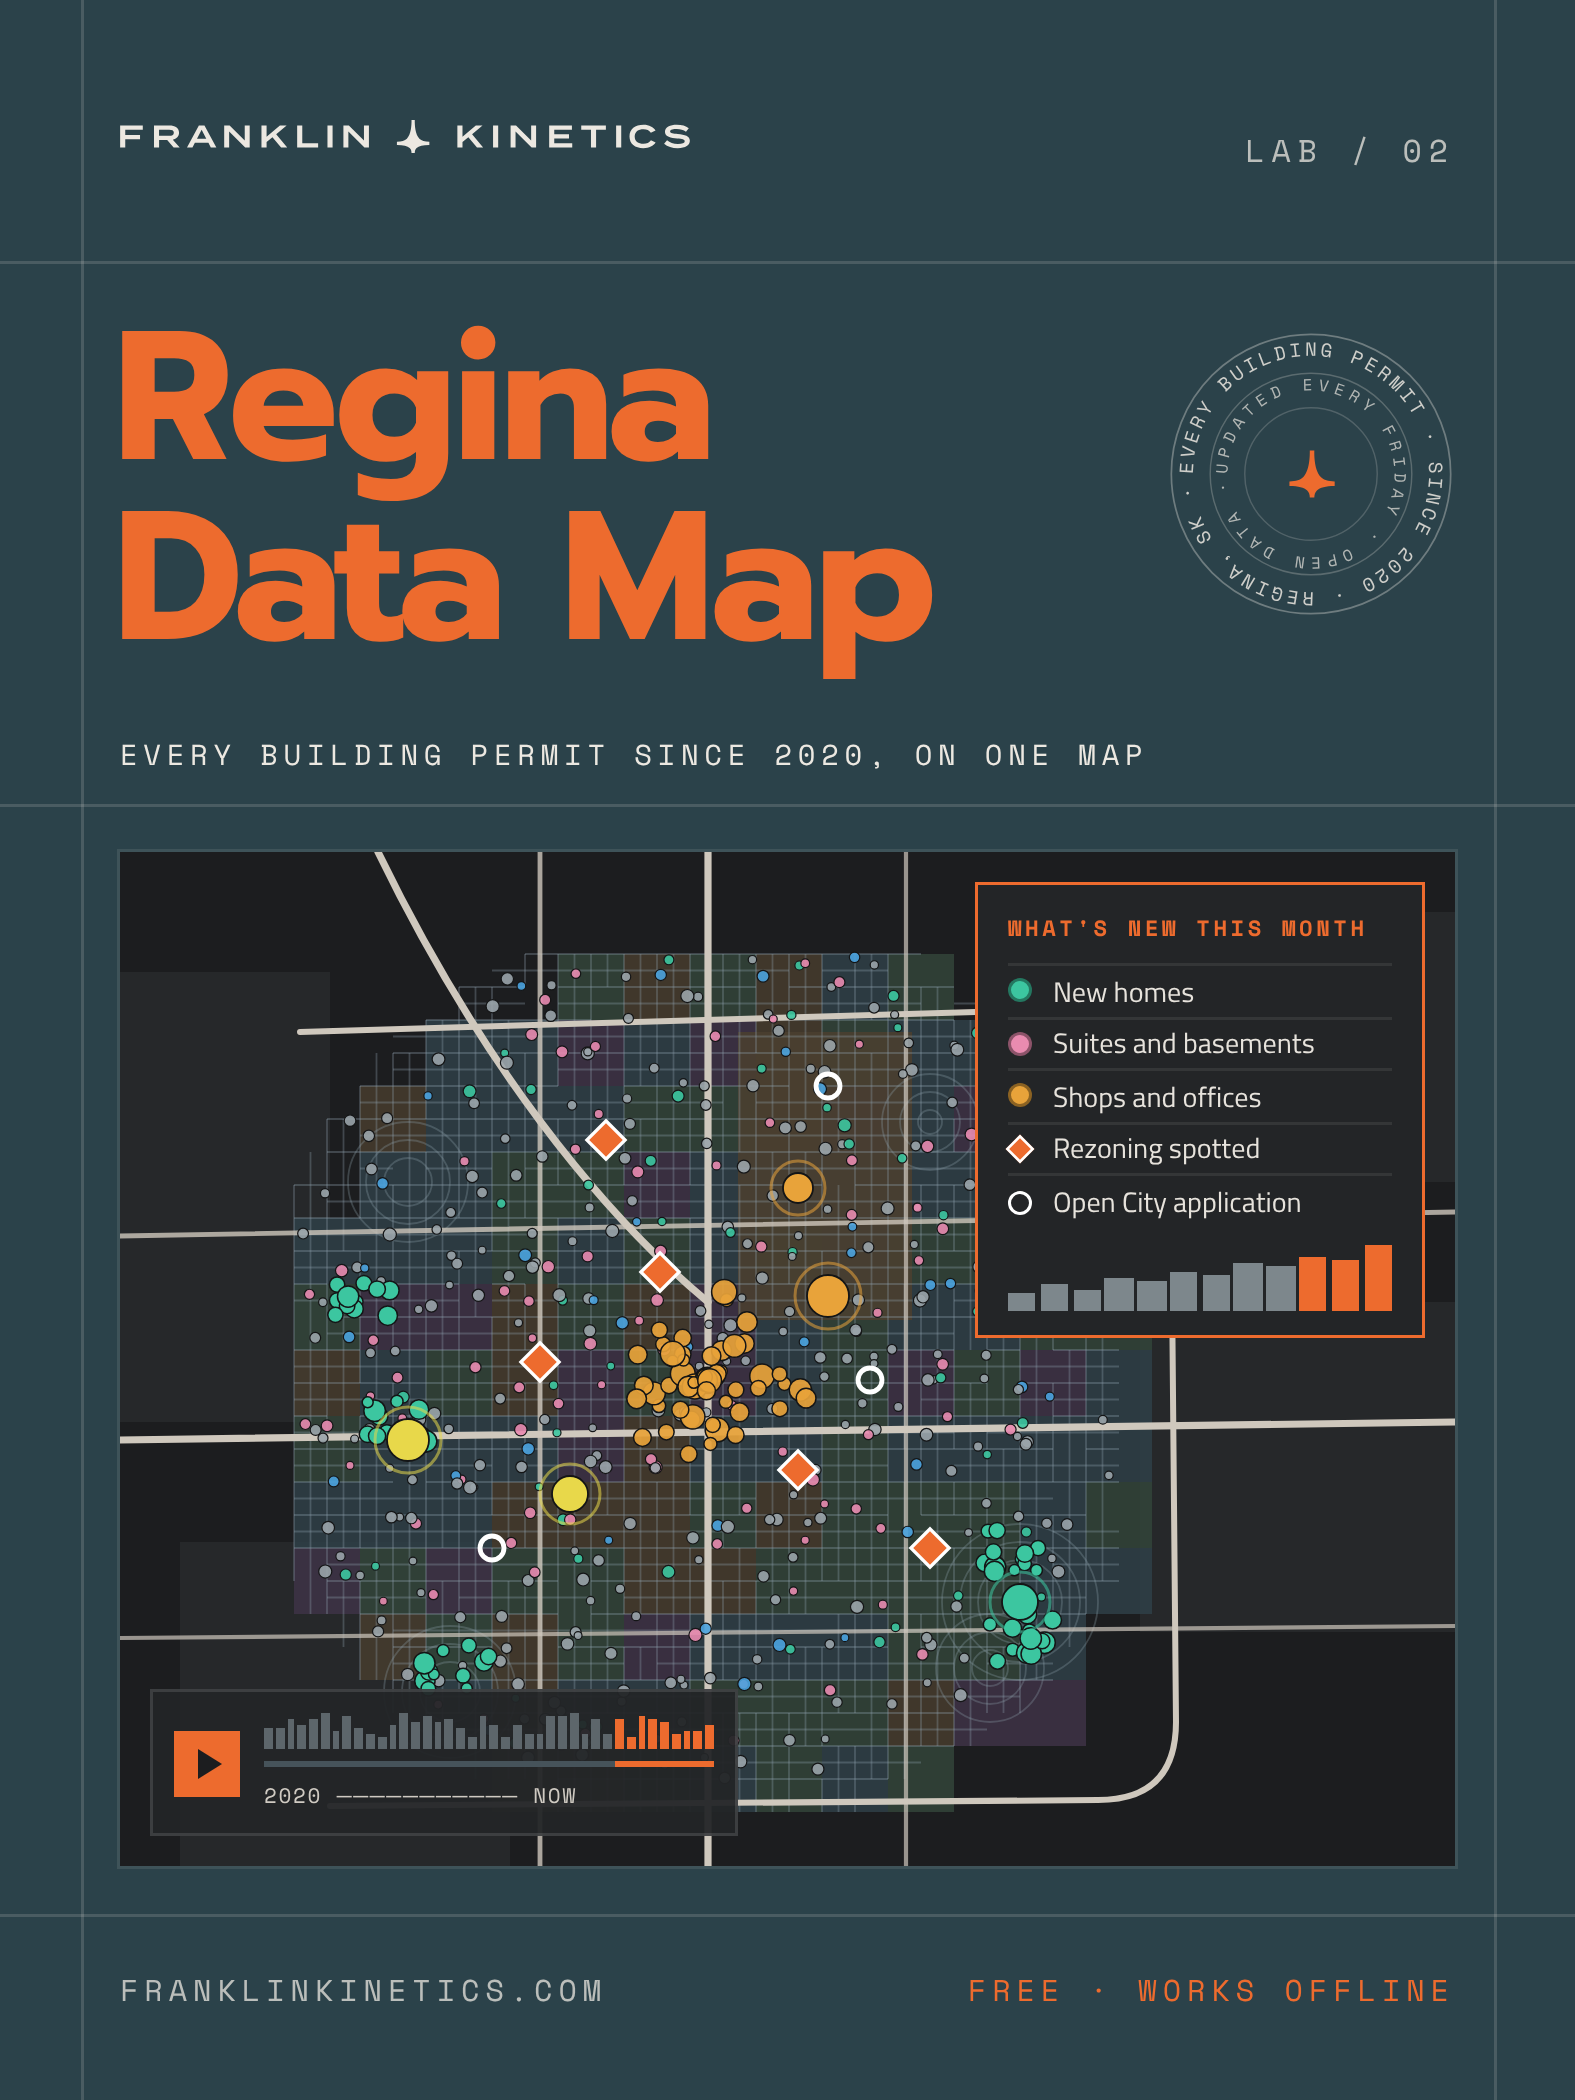
Live MAP
Every dot is a building permit the City of Regina issued. Click one for the details, or try a story below. A permit means work is approved to begin, not that it's finished or will cost what was declared.
Six questions, one click each
Each story sets up the map to answer one question about Regina, then gets out of the way so you can keep exploring.
Rezonings are spotted by comparing the City's zoning maps week to week, so the rezoning record starts in July 2026 and grows from there. Earlier rezonings aren't included.
Slide through time, then press play
Any stretch of time since January 2020. The map holds every permit the City has published since then, more than 17,600 of them. Drag the snapshot slider to see the last week, month, quarter or year up to any day. Or switch to "Between two dates" and set your own range with two handles, typed dates or shortcuts like "2022".
Watch Regina grow. Press play and any stretch of time becomes a time-lapse: a month clock, new permits flashing in, rings around big projects, a neighbourhood leaderboard, callouts for notable permits and a short recap at the end. "Travel through the years" rolls a twelve-month window from 2020 to now.
Charts that keep up. Permits, value and new homes by month since 2020, plus a year-by-year bar chart for each neighbourhood.
Wander a little. "Surprise me" drops you somewhere interesting, the neighbourhood spotlight tells you what's happening in one area, and every view has a link you can share.
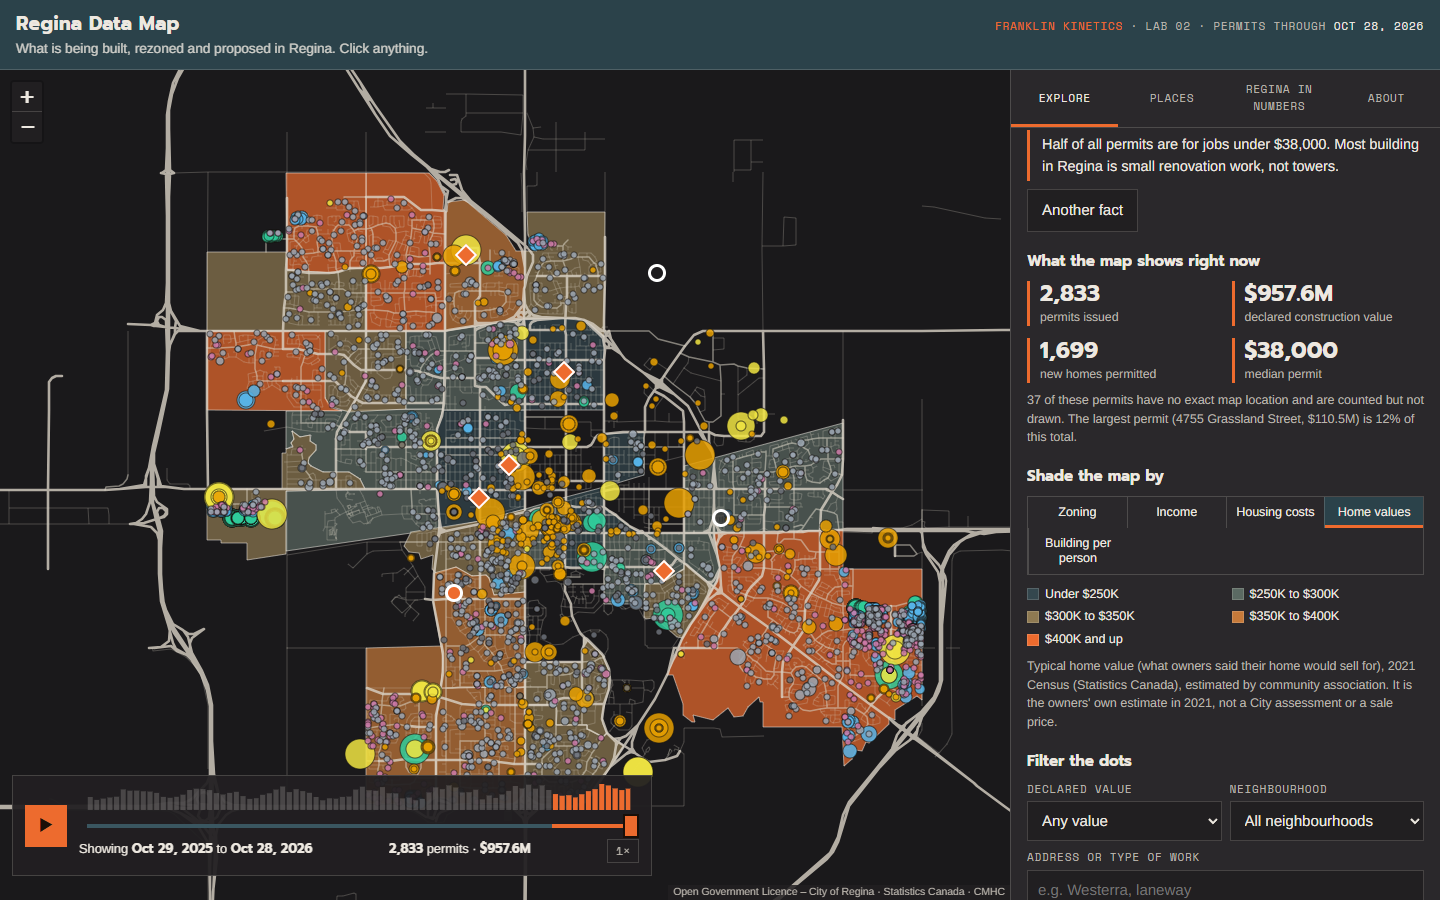
Colour the city by what you care about
Shade Regina's 28 community areas by zoning, income, housing costs, typical home value (2021 Census) or building per person, then look at the permits on top.
Three of these are estimates. The Census doesn't publish figures for Regina's community associations, so income, housing costs and home values are estimated from smaller Census areas, weighted by how much each one overlaps. They're a good guide for comparing areas, not a precise count.
Home value is what owners said their own home was worth in the 2021 Census. It isn't a City assessment, a sale price or today's market value.
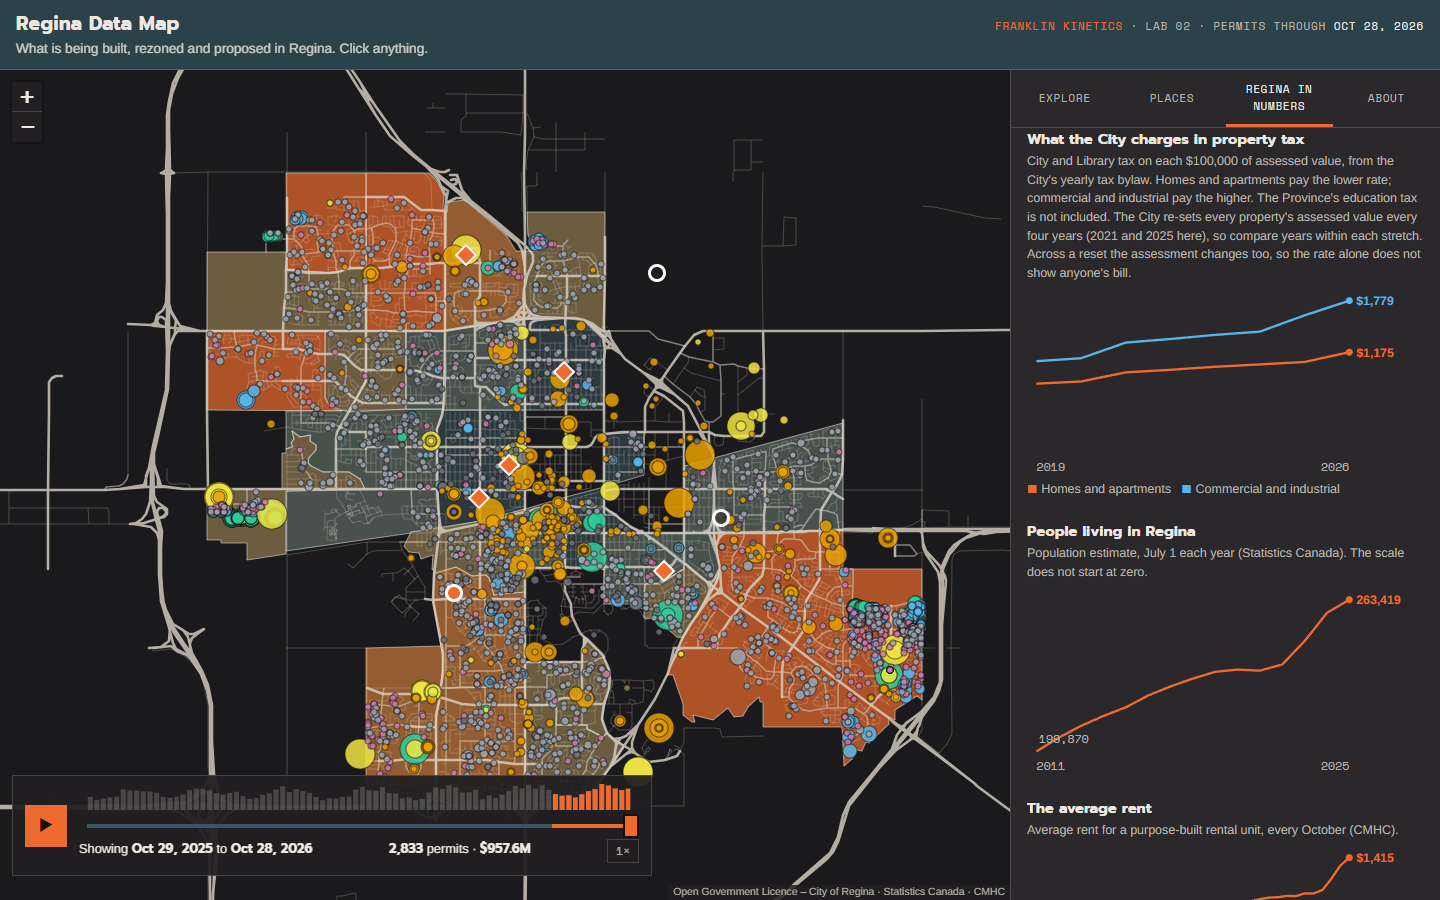
The bigger picture
The "Regina in numbers" tab puts the permits in context with Statistics Canada and CMHC figures: how many people live here, average rent, how easy it is to find a place, and where new residents come from.
What the City charges in property tax, 2019 to now. One chart shows the City and Library tax on each $100,000 of assessed value, for homes and for commercial property, with the reassessment years marked. The Province's education tax is extra and isn't included. The map doesn't contain anyone's property assessment or tax bill.
Always true
Built only from government data.
No company, applicant or owner names. It's about places and projects.
A permit means work can start, not that it's finished.
Rezoning history starts in July 2026.
Made in Regina, not by the City of Regina.
Made for everyone
Works on phones: the map sits above the controls.
A table version for keyboard and screen-reader users.
"Did you know" facts if you just want the highlights.
What you get
The live map, updated every Friday morning
A one-file download that opens in any browser and works offline
A "Save a copy of this map" button on the live page
Make it yours with AI: a short guide, in the download, to having an AI assistant change the map for your needs
Permit data as CSV and GeoJSON, free to use
What you need
A web browser. That's it.
For the download on a phone: save the file, then open it from Files.
See what Regina is building, one dot at a time.
Every building permit the City of Regina has issued since January 2020, on one free, interactive map, with zoning, rezonings, open City applications and the numbers behind them. Pick a story, press play and watch the city grow. It updates itself every Friday.
Use it below, or download a one-file copy that works offline, plus a short guide to making it your own with AI.
Free. Nothing to install.
Questions
-
Yes. The live map is free to use with no sign-up. The download goes through a $0 checkout and the file arrives by email.
-
Only government sources. Building permits, zoning, addresses and development applications come from City of Regina open data. Population, migration, income, housing costs and home values come from Statistics Canada. Rent and vacancy come from CMHC's Rental Market Survey. Property-tax rates come from the City's yearly Property Tax Bylaws.
-
Every Friday morning. The City publishes new permits on Thursdays and the live map picks them up the next day, so the newest few days are always missing until then. The map shows the date its data runs to. A downloaded copy swaps in the newest data whenever it's opened online.
-
Yes. The live map works in your phone's browser; tap "Open the map full screen" for the most room. For the download, save the file and open it from your Files app.
-
Yes. The permit data is free to download as CSV and GeoJSON at regina-build-map.franklinkinetics.com/data, and you can save a copy of the whole map and change it however you like. The download includes a short guide, Make it yours with AI, with starter prompts for doing that with an AI assistant. The data keeps its original licences, so credit the sources listed at the bottom of this page.
-
Income, housing costs and home values. The Census doesn't publish those figures for Regina's 28 community associations, so the map estimates them from smaller Census areas, weighted by how much each overlaps. Use them to compare areas, not as exact numbers.
-
No. The map doesn't contain anyone's assessed value or tax bill. Home value is what owners themselves reported in the 2021 Census, and the tax chart shows the City and Library rates only; the Province's education tax is extra. The map isn't a City of Regina product.
-
Because public data is more useful when people can actually read it. It's also a working example of what Franklin Kinetics builds: data turned into something people use. If you'd like one for your business, read on.
Made by Franklin Kinetics, Regina. Not affiliated with the City of Regina. Information, not advice; may contain errors.Contains information licensed under the Open Government Licence – City of Regina.Adapted from Statistics Canada, Population estimates, July 1, by census subdivision, 2021 boundaries (Table 17-10-0155-01); Components of population change by census metropolitan area and census agglomeration (Table 17-10-0149-01); and the 2021 Census of Population. This does not constitute an endorsement by Statistics Canada of this product.Source: Canada Mortgage and Housing Corporation, Rental Market Survey.Property-tax rates from the City of Regina's annual Property Tax Bylaws, 2019 onward.Want this kind of system inside your business?
This map started as a stack of City files that nobody had time to read. Now it answers a question in one click and keeps itself up to date every Friday.
Most Regina businesses have a stack like that: public data about their market, plus their own sales, quotes and schedules. Franklin Kinetics turns it into tools your team actually uses. If you run a business in Regina, let's talk about what yours could look like.
